ArangoDB v3.11 reached End of Life (EOL) and is no longer supported.
This documentation is outdated. Please see the most recent stable version.
Cluster
The web interface differs for cluster deployments and single-server instances. Instead of a single Dashboard, there is a CLUSTER and a NODES section.
Furthermore, the REPLICATION and LOGS section are not available. You can access the logs of individual Coordinators and DB-Servers via the NODES section.
The cluster section displays statistics about the general cluster performance.

Statistics:
- Available and missing Coordinators
- Available and missing DB-Servers
- Memory usage (percent)
- Current connections
- Data (bytes)
- HTTP (bytes)
- Average request time (seconds)
Nodes
Overview
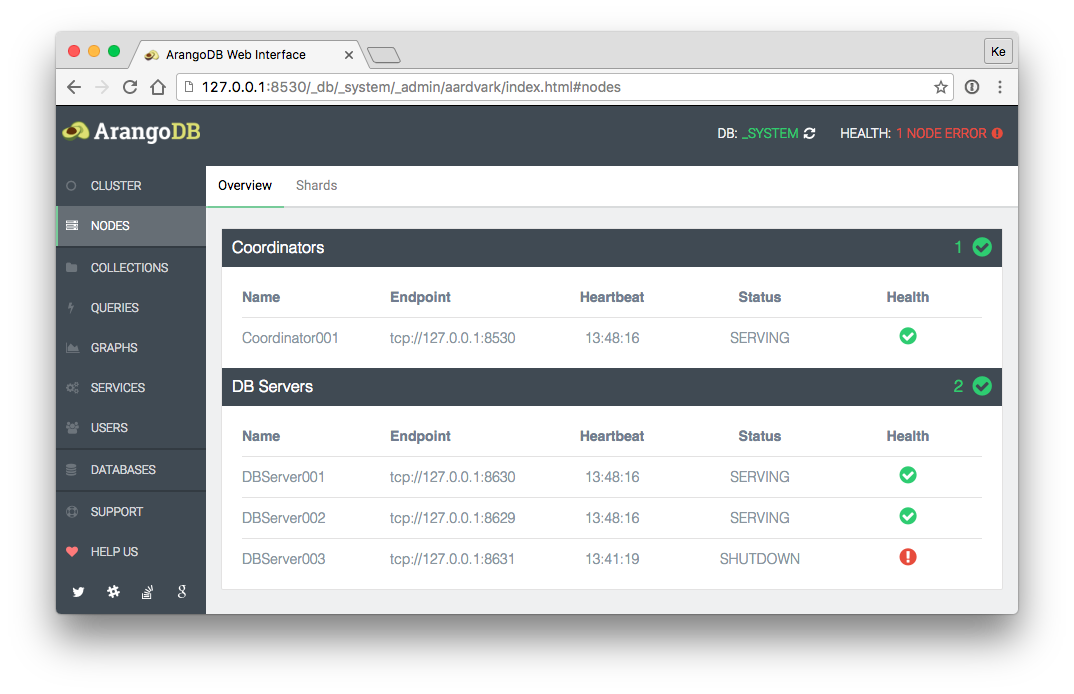
The overview shows available and missing Coordinators and DB-Servers.

Functions:
- Coordinator Dashboard: Click on a Coordinator will open a statistics dashboard.
Information (Coordinator / DB-Servers):
- Name
- Endpoint
- Last Heartbeat
- Status
- Health
Shards
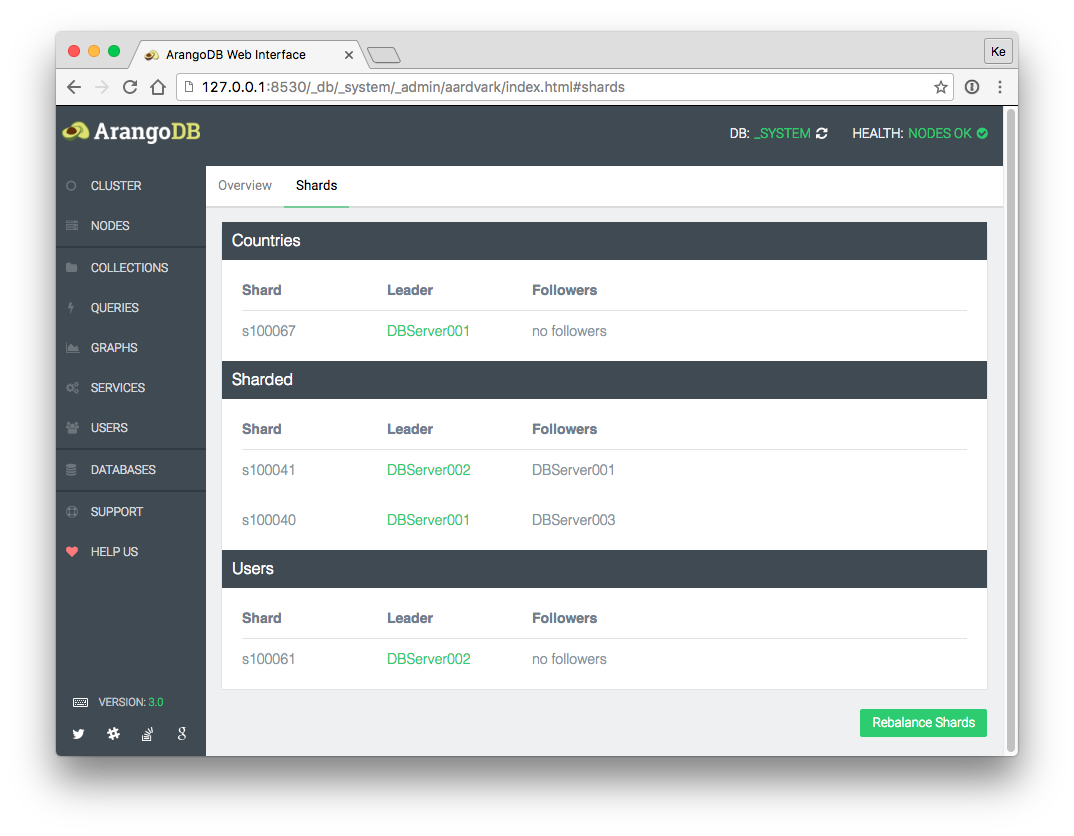
The shard section displays all available sharded collections.

Functions:
- Move Shard Leader: Click on a leader database of a shard server will open a move shard dialog. Shards can be transferred to all available DB-Servers, except the leading DB-Server or an available follower.
- Move Shard Follower: Click on a follower database of a shard will open a move shard dialog. Shards can be transferred to all available DB-Servers, except the leading DB-Server or an available follower.
Information (collection):
- Shard
- Leader (green state: sync is complete)
- Followers
Rebalance Shards
The rebalance shards section displays a button for rebalancing shards.
A new DB-Server will not have any shards. With the rebalance functionality,
the cluster will start to rebalance shards including empty DB-Servers.
You can specify the maximum number of shards that can be moved in each
operation by using the --cluster.max-number-of-move-shards startup option
of arangod (the default value is 10).
When the button is clicked, the number of scheduled move shards operations is
shown, or it is displayed that no move operations have been scheduled if they
are not necessary.
