Monitoring & Metrics in ArangoGraph
ArangoGraph provides various built-in tools and integrations to help you monitor your deployment
The ArangoGraph Insights Platform provides integrated charts, metrics, and logs to help you monitor your deployment. This allows you to track your deployment’s performance, resource utilization, and its overall status.
The key features include:
- Built-in monitoring: Get immediate access to monitoring capabilities for your deployments without any additional setup.
- Chart-based metrics representation: Visualize the usage of the DB-Servers and Coordinators over a selected timeframe.
- Integration with Prometheus and Grafana: Connect your metrics to Prometheus and Grafana for in-depth visualization and analysis.
To get started, select an existing deployment from within a project and click Monitoring in the navigation.

Built-in monitoring and metrics
In the Servers section
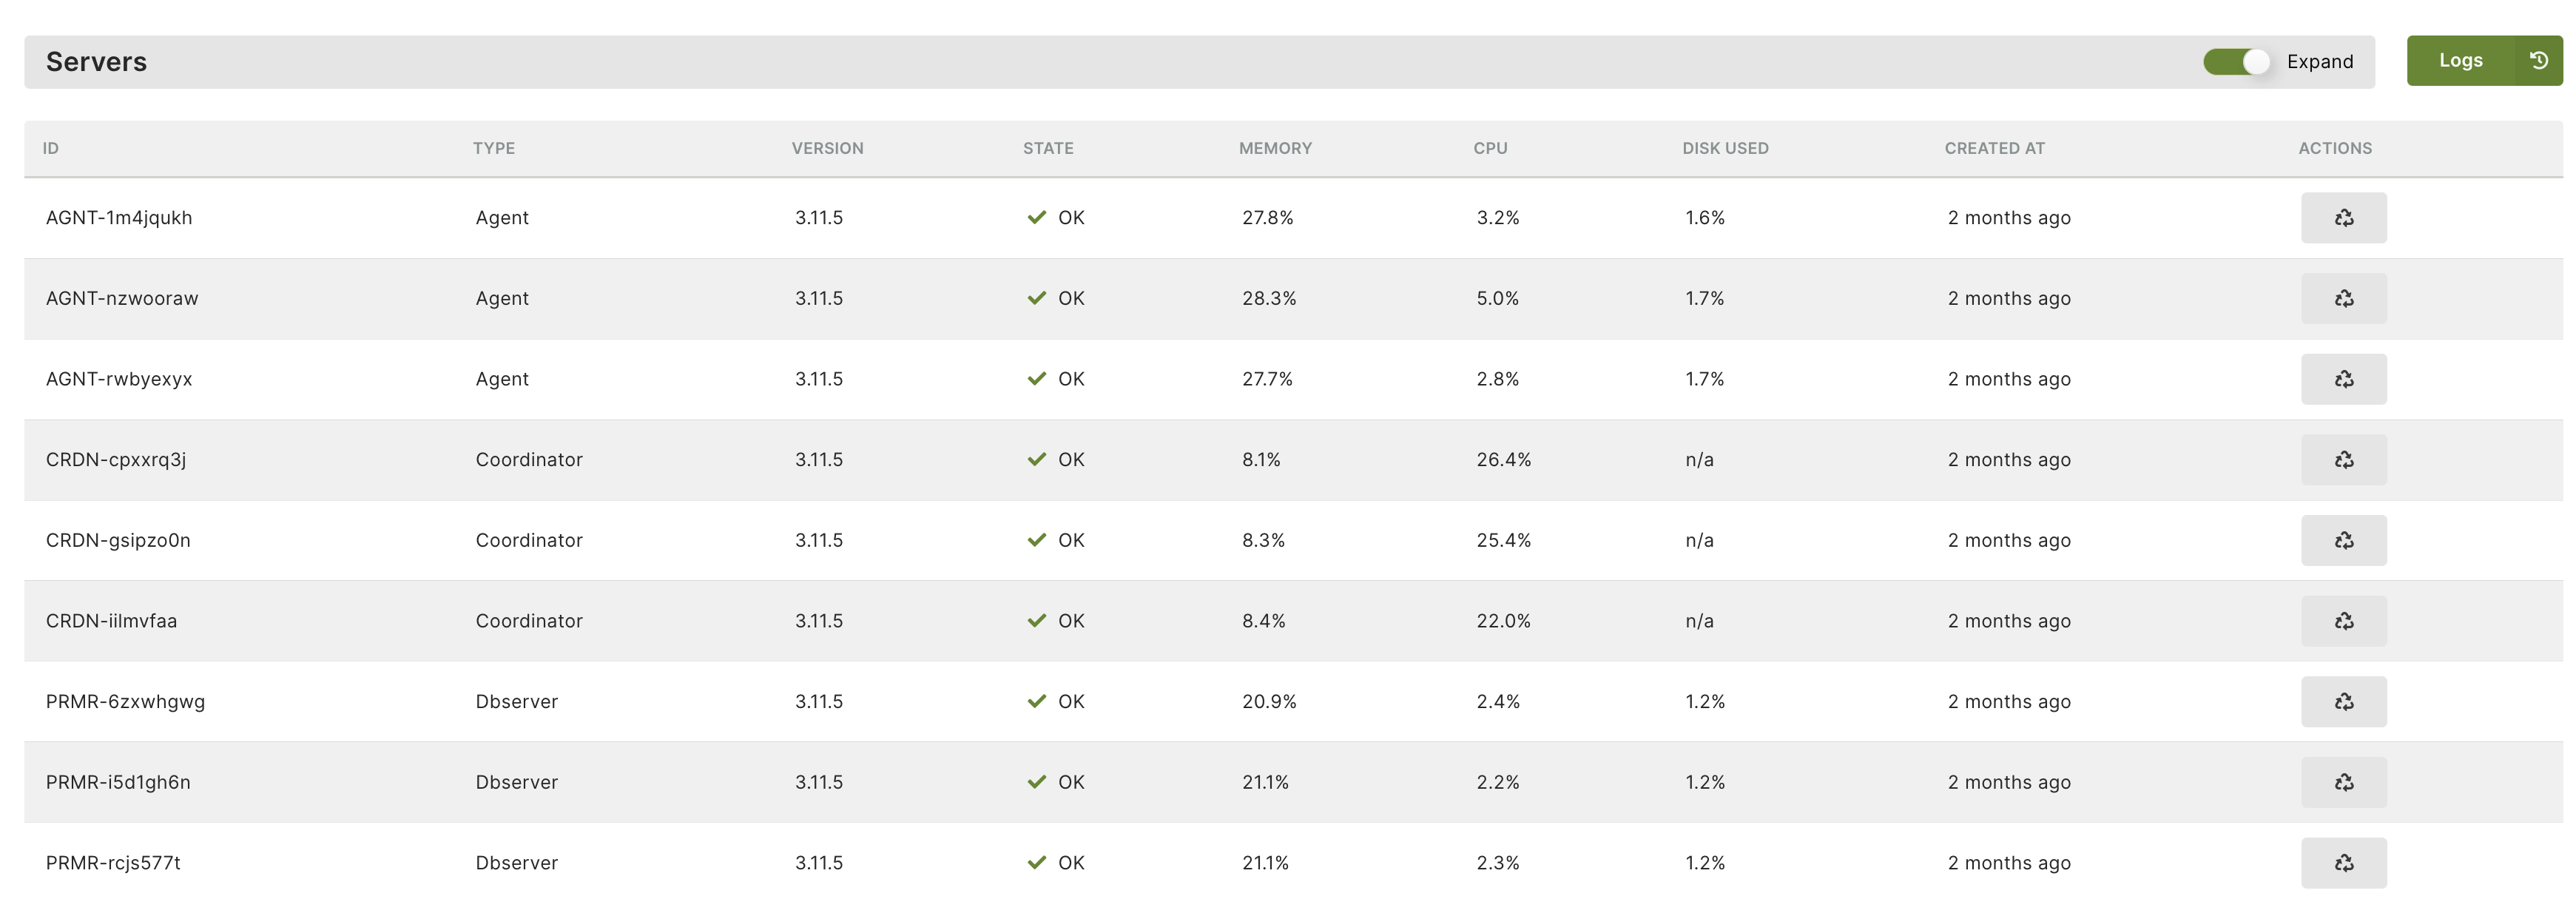
The Servers section offers an overview of the DB-Servers, Coordinators, and Agents used in your deployment. It provides essential details such as each server’s ID and type, the running ArangoDB version, as well as their memory, CPU, and disk usage.
In case you need to perform a restart on a server, you can do so by using the Gracefully restart this server action button. This shuts down all services normally, allowing ongoing operations to finish gracefully before the restart occurs.
Additionally, you can access detailed logs via the Logs button. This allows you to apply filters to obtain logs from all server types or select specific ones (i.e. only Coordinators or only DB-Servers) within a timeframe. To download the logs, click the Save button.

In the Metrics section
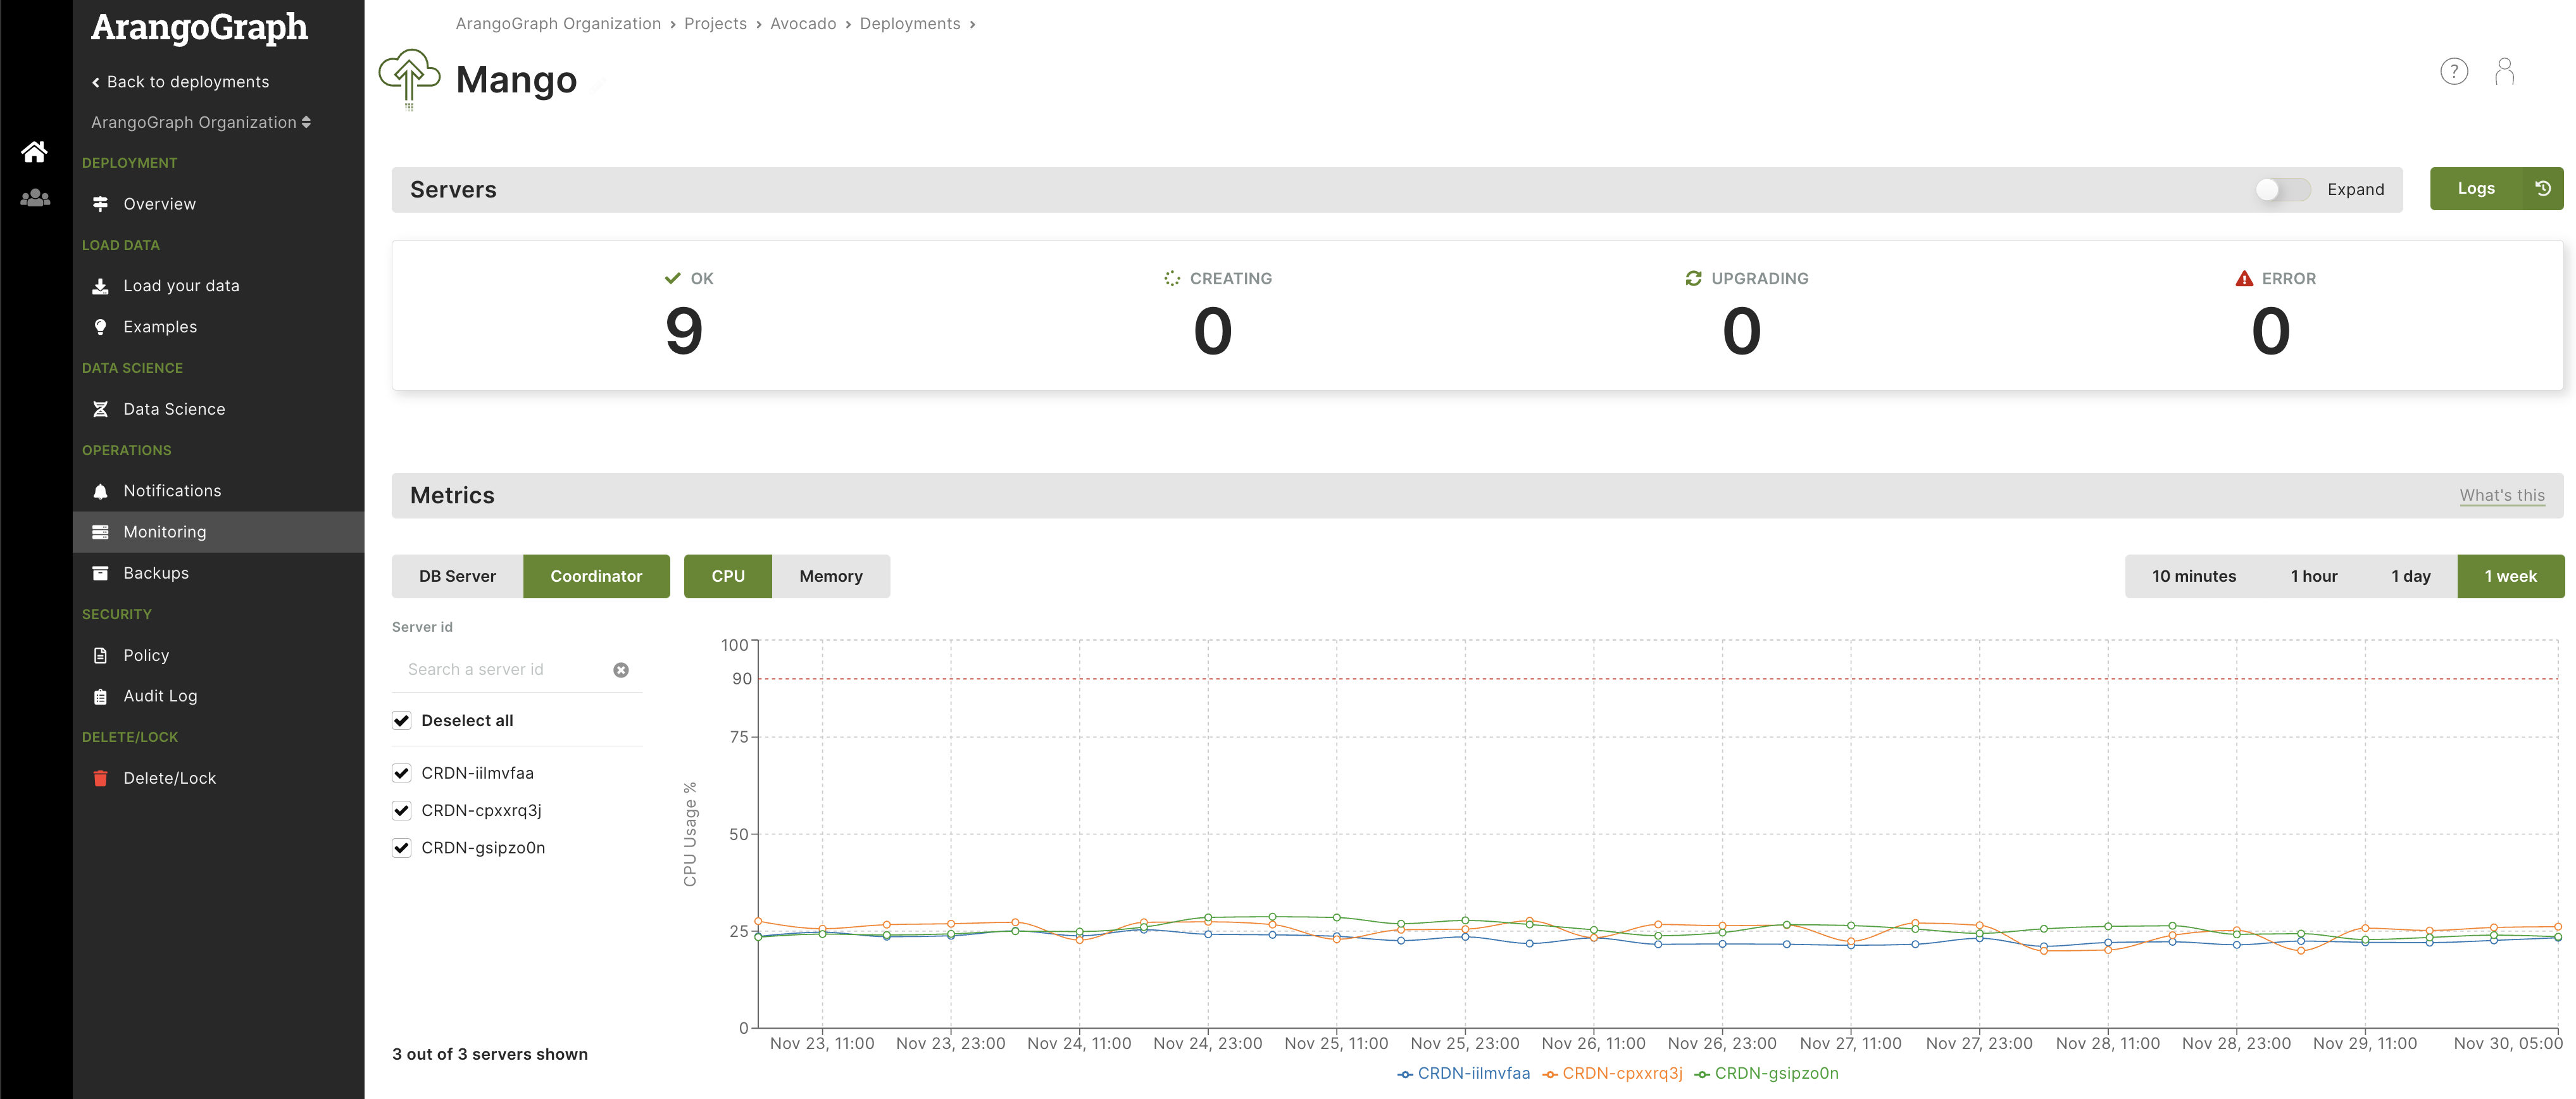
The Metrics section displays a chart-based representation depicting the resource utilization of DB-Servers and Coordinators within a specified timeframe.
You can select one or more DB-Servers and choose CPU, Memory, or Disk to visualize their respective usage. The search box enables you to easily find a server by its ID, particularly useful when having a large number of servers or when needing to quickly find a particular one among many.
Similarly, you can repeat the process for Coordinators to see the CPU and Memory usage.

Connect with Prometheus and Grafana
The ArangoGraph Insights Platform provides metrics for each deployment in a Prometheus -compatible format. You can use these metrics to gather detailed insights into the current and previous states of your deployment. Once metrics are collected by Prometheus, you can inspect them using tools such as Grafana .

Metrics tokens
The Metrics tokens section allows you to create a new metrics token, which is required for connecting to Prometheus.
- To create a metrics token, click New metrics token.
- For Name, enter a name for the metrics token.
- Optionally, you can also enter a Short description.
- Select the Lifetime of the metrics token.
- Click Create.

How to connect Prometheus
- In the Metrics section, click Connect Prometheus.
- Create the
prometheus.ymlfile with the following content:global: scrape_interval: 60s scrape_configs: - job_name: 'deployment' bearer_token: '<fill-your-metrics-token-here>' scheme: 'https' static_configs: - targets: ['6775e7d48152.arangodb.cloud:8829'] tls_config: insecure_skip_verify: true - Start Prometheus with the following command:
docker run -d \
-p 9090:9090 -p 3000:3000 --name prometheus \
-v $(pwd)/prometheus.yml:/etc/prometheus/prometheus.yml:ro \
prom/prometheus
This command also opens a port 3000 for Grafana. In a production environment, this is not needed and not recommended to have it open.
How to connect Grafana
Start Grafana with the following command:
docker run -d \
--network container:prometheus \
grafana/grafana
Go to
localhost:3000and log in with the following credentials:- For username, enter admin.
- For password, enter admin.
After the initial login, make sure to change your password.To add a data source, click Add your first data source and then do the following:
- Select Prometheus.
- For HTTP URL, enter
http://localhost:9090. - Click Save & Test.
To add a dashboard, open the menu and click Create and then Import.
Download the Grafana dashboard for ArangoGraph .
Copy the contents of the
main.jsonfile into the Import via panel json field in Grafana.Click Load.
