Dashboard
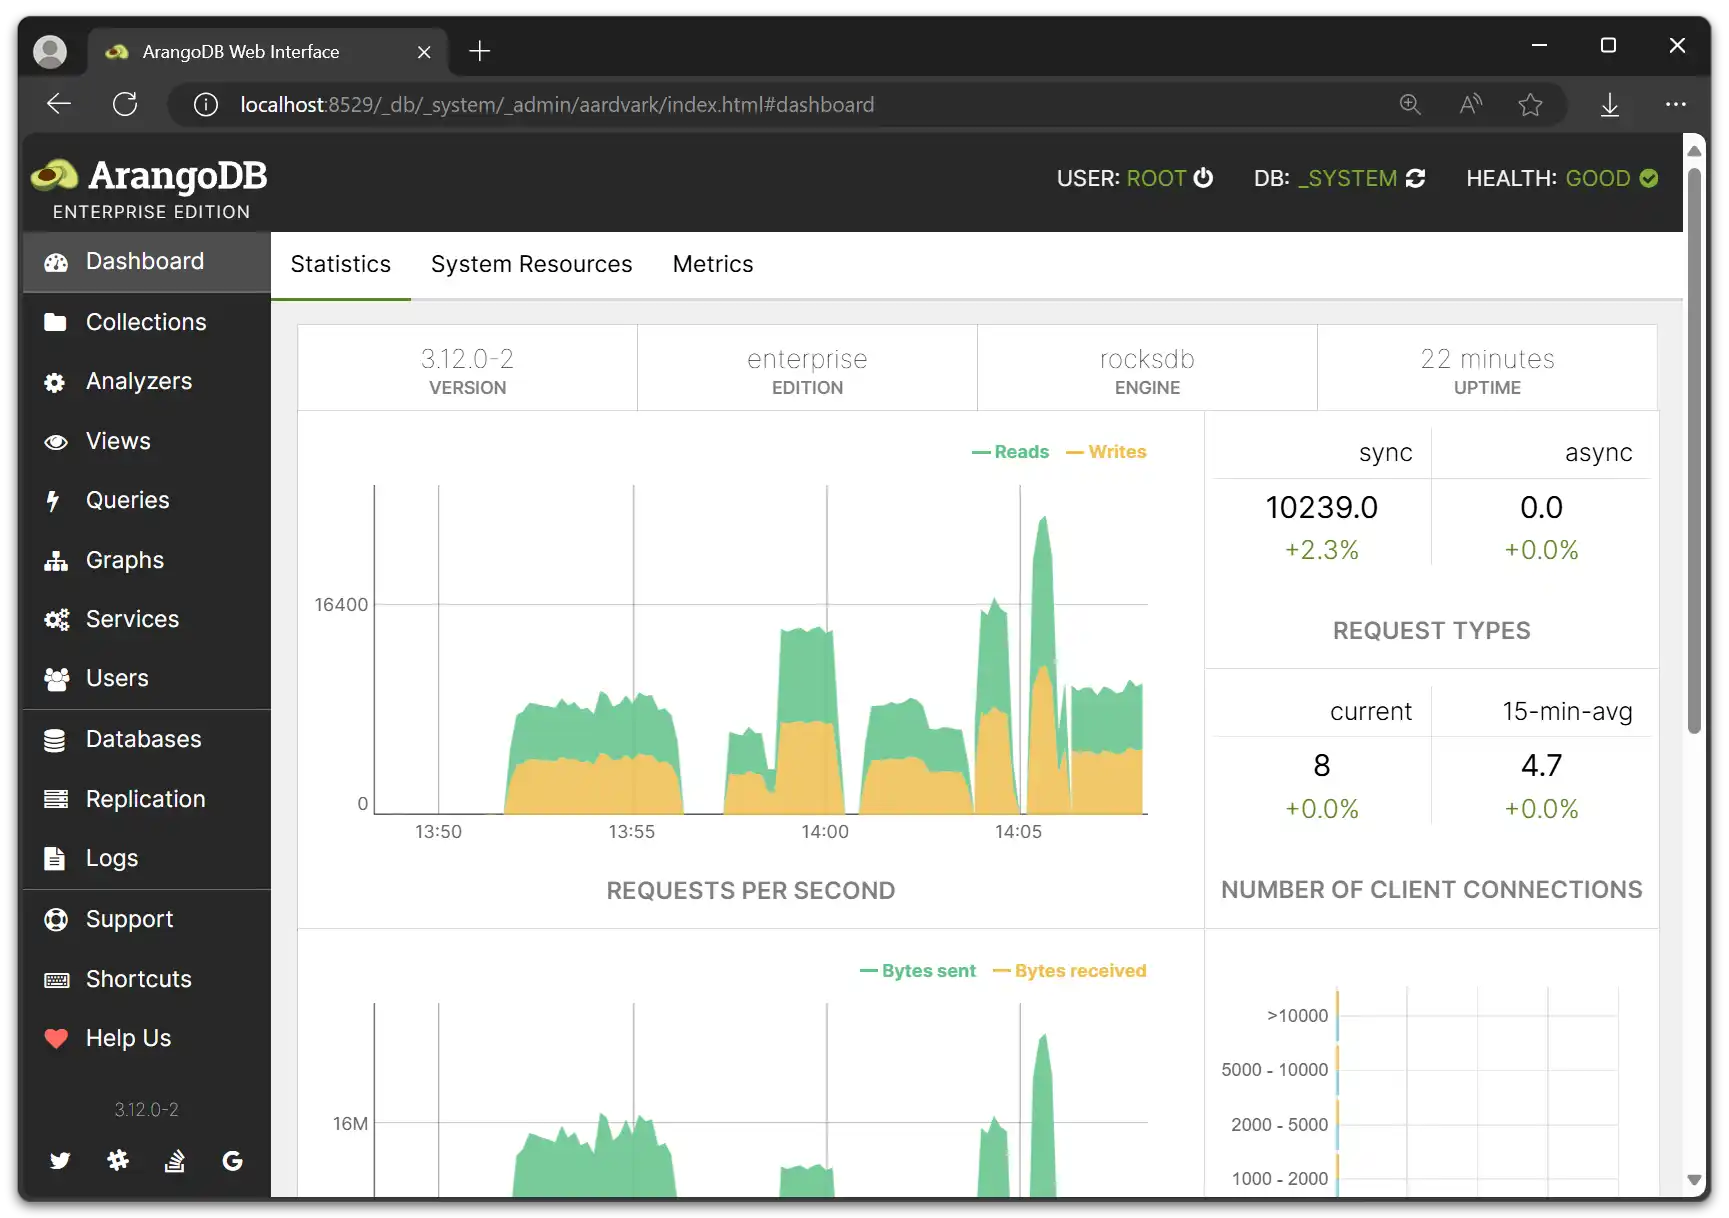
The DASHBOARD section provides statistics which are polled regularly from the ArangoDB server.

There is a different interface for Cluster deployments.
Statistics:
- Requests per second
- Request types
- Number of client connections
- Transfer size
- Transfer size (distribution)
- Average request time
- Average request time (distribution)
System Resources:
- Number of threads
- Memory
- Virtual size
- Major page faults
- Used CPU time
Metrics:
- Various server metrics, see Monitoring

